Using Drought to Read Habitat Quality
Part 1 of the Preseason Planning Series
Ann Jandernoa
July 10, 2026
Planning Your Hunt
Planning a successful hunt begins long before you load your gear or pull into the parking area. Some hunters return to covers they have hunted for years, while others travel to completely new areas. Most begin by talking with friends, reading bird reports, searching social media, or asking questions on hunting forums. While that information can be helpful, it often reflects what happened yesterday or even last season. Conditions on the landscape can change dramatically from one year to the next.
Unless you drive hundreds of miles, spend days running back roads, stop at grain elevators, and visit with local farmers and ranchers, you’re left wondering what conditions really look like. From ten hours away, it’s difficult to know whether the habitat has held up, whether food and insects are abundant, or whether enough birds survived to make the trip worthwhile.
Technology has become a valuable tool—if you know where to look. No single report tells the whole story, but when you begin combining several sources of information, a picture starts to emerge. What once required driving hundreds of miles and seeing conditions firsthand can now be understood from much farther away. By looking at the right combination of information, you can begin to understand how the landscape has changed and whether conditions are likely to support the kind of hunt you’re planning.
Weather is the single greatest influence on habitat quality. Wildlife has adapted to normal seasonal weather patterns, but when those patterns depart from normal, habitat quality begins to change. Drought, excessive rainfall, prolonged heat, or unusually cool conditions all influence the availability of food, cover, moisture, and insects. Those changes ultimately influence where wildlife spends its time. The goal is not simply to understand the weather. The goal is to understand how weather has influenced habitat quality.
Most hunters recognize that a cold, wet spring can reduce nesting success, and when favorable weather produces a good hatch, everyone breathes a sigh of relief. But a successful hatch is only the beginning. As spring turns into summer, the weather continues to influence habitat quality every day.
Young chicks require tremendous amounts of protein during their first weeks of life, and insects provide much of that nutrition. When prolonged heat and drought reduce insect populations and the quality of vegetation, hens are forced to move their broods farther in search of food. Every additional movement requires more energy, exposes chicks to more predators, and reduces their chances of survival. By the time hunting season arrives, bird numbers often reflect conditions that developed months after the hatch.
During my years farming, we worked close to a couple of thousand acres of corn, soybeans, and wheat, and one thing became obvious. Insects are not evenly distributed across the landscape. Large corn and soybean fields are monocultures, designed to efficiently produce a single crop. While they play an important role in agriculture and are a leftover food source after harvest, they generally do not provide the diversity of insects and succulent vegetation that growing broods require.
Instead, insects are often concentrated where plant diversity and moisture remain. Alfalfa fields, hay fields, lightly grazed pastures, field edges, native grasslands, wetlands, and other productive habitats continue supporting insects long after surrounding areas begin to dry. As conditions become hotter and drier, birds respond by shifting toward habitats where food, cover, and especially moisture remain available.
Survival is rarely an accident. Birds that live in high-quality habitat have an advantage because the essential ingredients for survival, such as food, insects, cover, water, and security, are found in close proximity. They spend less time and energy searching for their daily needs and more time feeding, growing, resting, and avoiding predators. When weather influences habitat quality, they often need to shift only a short distance to find another area that provides those same resources.
Birds living in low-quality habitat face a different challenge. Food, cover, insects, and moisture may all be present, but they are often scattered across the landscape. As habitat quality declines, birds are forced to travel farther between those resources. Every additional movement requires energy, increases exposure to predators, and places greater demands on both adults and growing broods. Over time, those added costs influence survival.
In many ways, habitat quality can be measured by the distance a bird must travel to meet its daily needs. The better the habitat, the shorter the shift. The poorer the habitat, the farther birds must travel as weather and the seasons influence habitat quality. Habitat must have continuity.
This understanding changes the way we plan a hunt. Instead of asking, “Where were the birds last year?” we begin asking a different question: “How has drought influenced habitat quality since then?” The answer to that question often explains where birds are today.
Understanding Drought and What It Means for Habitat
I think the most useful way to think about drought is this:
Drought doesn’t tell you where the birds are. It tells you how much environmental stress the landscape has been under.
Everything else is built from that.
What Drought Data Can Tell Us
Drought is one of the most valuable tools for understanding habitat because it measures the long-term moisture conditions affecting an entire landscape. Unlike a weather forecast, which tells us what happened over the past few days, drought data reflects the cumulative effects of weeks, months, and sometimes years of below-normal moisture.
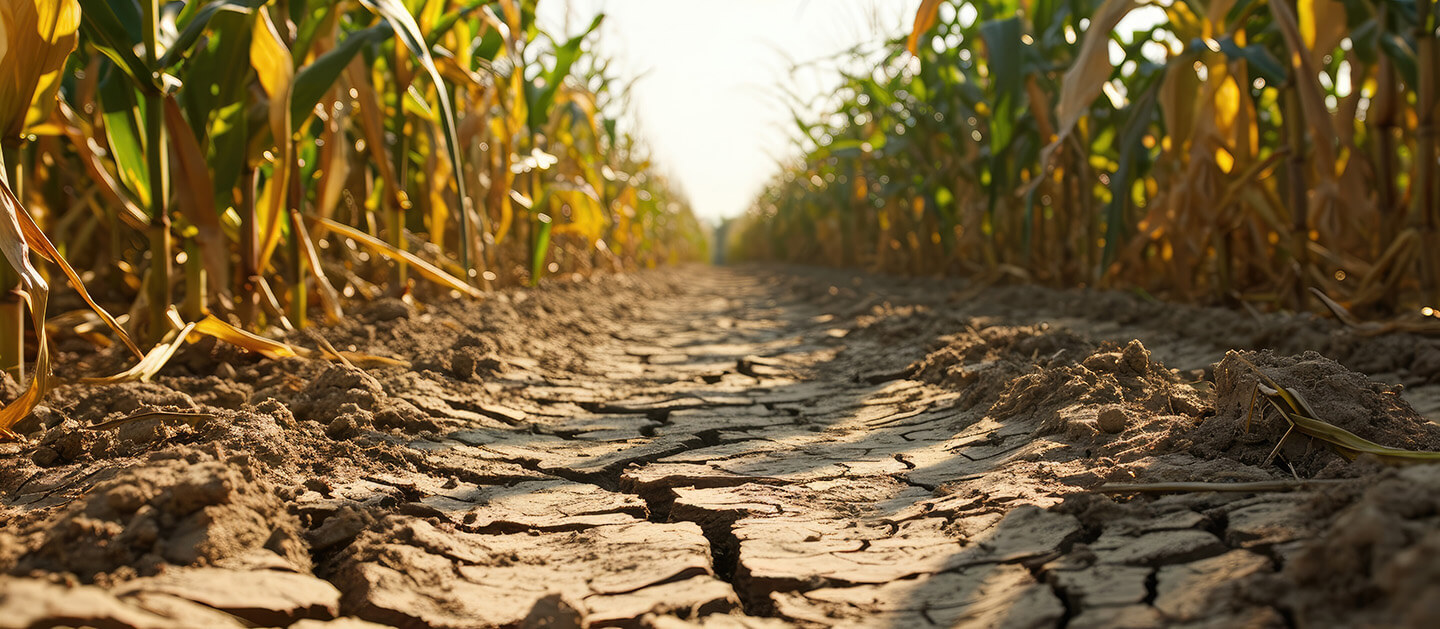
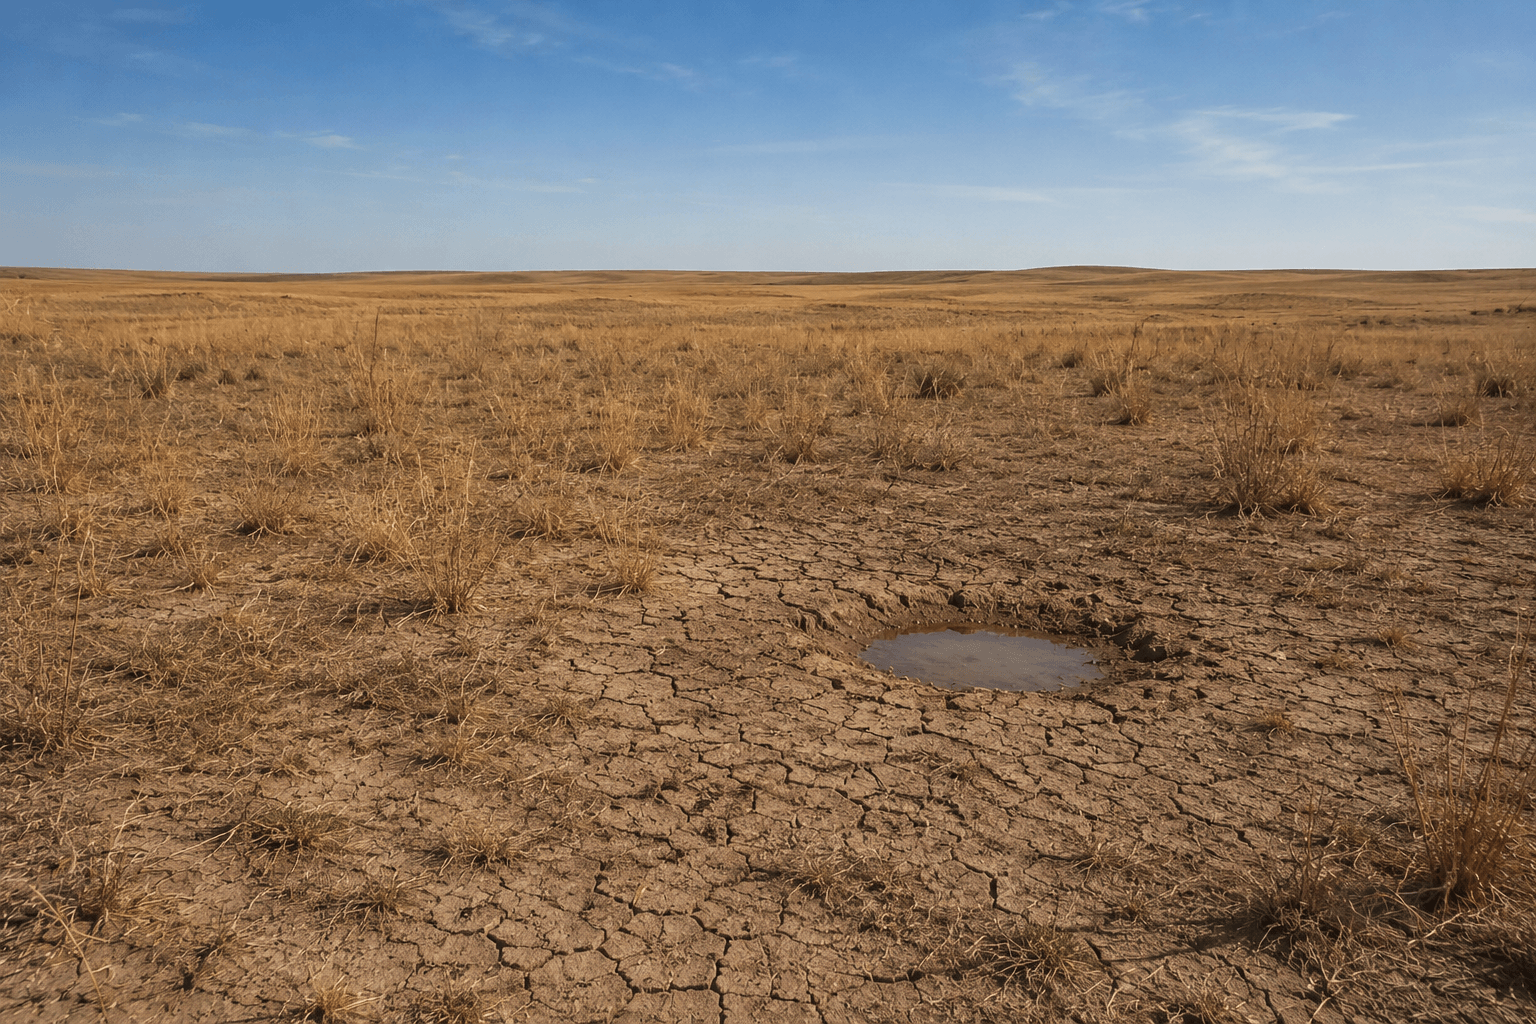
For upland birds, drought influences nearly every part of the biological system. As moisture deficits increase, vegetation becomes stressed, plant growth slows, insect production typically declines, and brood habitat gradually loses quality. These changes rarely occur overnight. Instead, they develop over time as the landscape responds to prolonged moisture shortages.
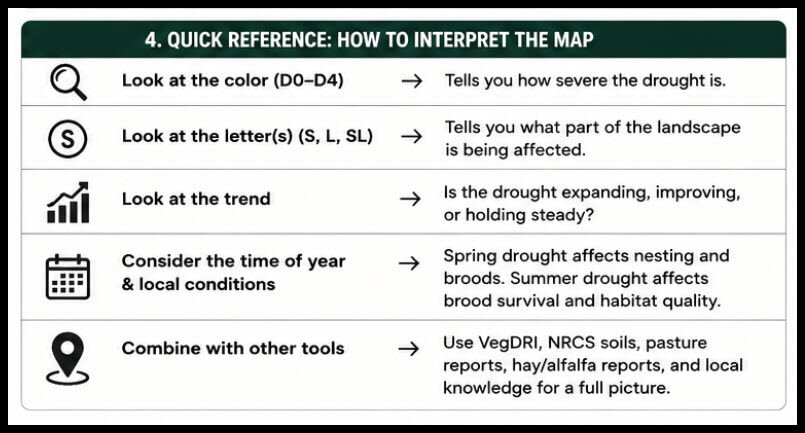
A drought map helps answer several important questions. Has this region been under moisture stress? How severe has that stress become? Is the drought expanding, improving, or remaining stable? Which areas are likely experiencing declining habitat quality? While drought maps cannot predict bird numbers directly, they provide valuable insight into why habitat conditions may be improving in one region while deteriorating in another.
How Drought Works
A common misconception is that drought simply means it hasn’t rained recently. In reality, drought is much more complex.
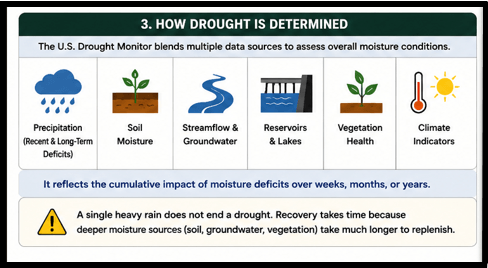
The U.S. Drought Monitor combines information from many different sources, including recent precipitation, long-term precipitation deficits, soil moisture, streamflow, groundwater conditions, reservoir levels, vegetation response, and climate data. Rather than measuring a single rainfall event, drought reflects the overall moisture condition of the landscape.
This is why a single heavy rainstorm rarely ends a drought. If the landscape has been dry for many months, soil, groundwater, wetlands, and vegetation may continue recovering long after rainfall returns. The effects of drought often linger well beyond the first good rain.
Understanding the Drought Categories
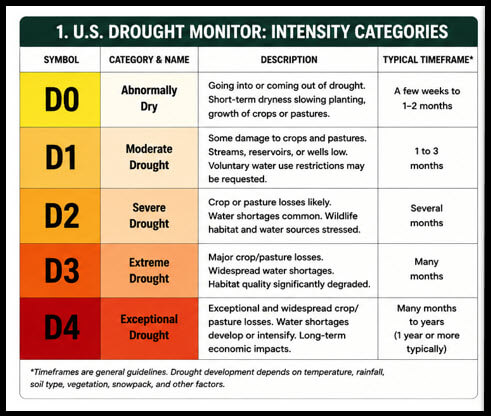
One of the biggest misconceptions is that the drought categories represent a specific amount of time. Many people assume D1 means one month of drought, D2 means two months, and so on. That is not how the system works.
The drought categories measure the severity of moisture stress, not the length of time. They represent the cumulative effects drought is having on the landscape.
D0 — Abnormally Dry is usually the first indication that moisture deficits are beginning to develop or that an area is recovering from drought. It often reflects conditions that have developed over the previous few weeks or one to two months.
D1 — Moderate Drought generally develops over one to three months, although extreme heat can accelerate the process. During this stage, crops begin showing stress, soil moisture declines, hay production slows, and pastures may begin deteriorating.
D2 — Severe Drought often reflects several months of below-normal moisture. By this point, soil moisture has become substantially depleted, vegetation stress is widespread, insect production typically begins declining, and brood habitat quality often starts to suffer.
D3 — Extreme Drought usually develops after many months of persistent dryness. Water shortages become increasingly serious, vegetation recovery slows dramatically, and habitat quality may decline across large portions of the landscape.
D4 — Exceptional Drought generally develops only after extended long-term moisture
deficits, often lasting a year or longer. Groundwater, streams, wetlands, reservoirs, and deep soil moisture are all affected. Recovery frequently requires multiple wet seasons rather than a single rainfall event.
Although these timeframes are generally true, drought does not follow a calendar. The speed at which drought develops depends on many interacting factors, including temperature, wind, humidity, soil type, vegetation, available water capacity, snowpack, and rainfall intensity. Sandy soil may reach drought conditions much faster than deep loam, even if both receive the same rainfall. Likewise, an exceptionally hot summer can push an area from D0 to D2 much faster than a cooler year with the same precipitation deficit.
Understanding the S, L, and SL Designations
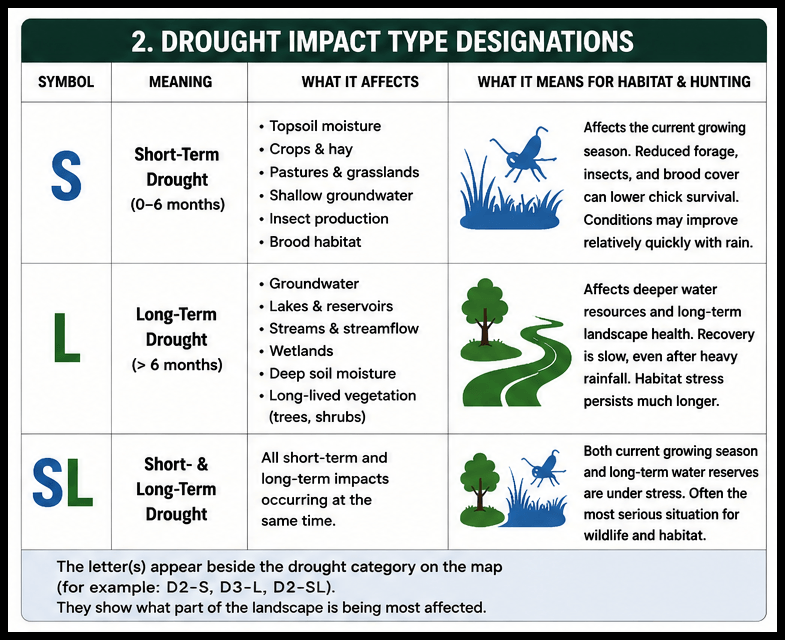
One of the most overlooked parts of the U.S. Drought Monitor is the small letter that often accompanies the drought category. While most people notice the color on the map, they never realize the letter may provide just as much valuable information.
The drought category tells you how severe the drought is. The letters indicate which part of the landscape is being affected.
An S indicates Short-Term Drought, generally affecting conditions that have developed over the past six months or less. These are the impacts hunters should pay particularly close attention to because they affect the current growing season. Crops, hay production, alfalfa growth, pasture conditions, grasslands, shallow soil moisture, insect production, and brood habitat all respond relatively quickly to short-term moisture shortages. For upland birds, an S designation is often one of the first warnings that habitat quality may be beginning to decline.
An L indicates Long-Term Drought, generally reflecting moisture deficits that have persisted for more than six months. Long-term drought affects the deeper components of the landscape, including groundwater, lakes, reservoirs, streamflow, wetlands, deep soil moisture, and long-lived vegetation such as trees and shrubs. These systems recover much more slowly, even after rainfall returns.
Occasionally, both letters appear together as SL. This indicates that the landscape is experiencing both short-term and long-term drought impacts simultaneously. Current vegetation is under stress, while deeper water reserves have also been depleted. Crops may be suffering, hay and alfalfa production may be declining, pastures may be deteriorating, surface soil moisture is low, streams and wetlands are being affected, and groundwater levels may also be dropping.
For habitat, this is often the most biologically significant situation because both the current growing season and the long-term health of the landscape are being affected at the same time.
Why the Letters Matter
Imagine two counties, both classified as D2 — Severe Drought.
The first county is classified as D2-S. This tells us the drought is primarily short-term. A wet weather pattern over the next month could improve conditions relatively quickly, allowing hay production, insect populations, and brood habitat to recover.
The second county is classified as D2-L. Here, the landscape has been dry for an extended period. Groundwater, wetlands, and deep soil moisture have already been depleted. Even if substantial rainfall occurs tomorrow, recovery will likely be much slower because the moisture deficit extends far below the soil surface.
A third county may be classified as D2-SL. This often represents the greatest concern for wildlife. Both the current growing season and the long-term water reserves are under stress. Reduced insect production, lower hay yields, declining pasture conditions, shrinking brood habitat, and fewer remaining green refuges all become increasingly likely.
Drought Is Only the Beginning
Drought should be viewed as the starting point, not the final answer.
It tells us how much environmental stress the landscape has experienced, but it does not indicate whether vegetation is responding well, how productive insect populations are, which fields provide excellent brood cover, or how individual habitat patches are performing.
As drought intensifies, the biological response generally follows a predictable sequence. Moisture deficits reduce soil moisture. Lower soil moisture slows plant growth. Reduced plant growth limits forb production. As vegetation quality declines, insect abundance typically declines as well. Eventually brood habitat quality decreases, leading to lower chick survival.
For hunters, this is where habitat intelligence begins. Bird reports often are not available until much later in the season. The landscape, however, has already been telling its story for months. By understanding drought and combining it with vegetation response, pasture condition, hay and alfalfa reports, and soil information, we gain a much clearer picture of how the habitat is functioning long before the first bird surveys or hunting reports are ever published.
Closing Thoughts
Understanding drought is about much more than knowing whether an area is dry. It is about understanding how long-term moisture conditions have influenced habitat quality across the landscape. As habitat quality changes, birds respond by shifting to the areas that best meet their needs. Those shifts affect brood survival, bird distribution, and ultimately the quality of the hunting you may encounter in the fall.
By learning to interpret drought conditions before your trip, you gain valuable insight into what the birds have experienced throughout the growing season. While no map can predict exactly where birds will be found, drought provides one of the clearest pictures of the environmental stress the landscape has endured and the potential impact on this year’s hatch and brood survival. It is one of the first clues to understanding what kind of hunting season may lie ahead.
In Part 2 of this series, we’ll add another powerful tool for researching the destination areas where you plan to hunt. When combined with drought information, it will provide an even clearer picture of habitat quality and help you better understand how birds have responded to changing environmental conditions. As you continue adding these tools to your preseason planning toolkit, you’ll begin making hunting decisions based on habitat intelligence rather than guesswork.